Head-related transfer functions
You can work with head-related transfer functions (HRTFs) using the three
classes HRTF (a single pair of left/right ear HRTFs),
HRTFSet (a set of HRTFs, typically for a single individual), and
HRTFDatabase (for working with databases of individuals). At the
moment, we have included only one HRTF database, the IRCAM_LISTEN
public HRTF database. There is also one artificial HRTF database,
HeadlessDatabase used for generating HRTFs of artifically introduced ITDs.
An example of loading the IRCAM database, selecting a subject and plotting the pair of impulse responses for a particular direction:
hrtfdb = IRCAM_LISTEN()
hrtfset = hrtfdb.load_subject(1002)
hrtf = hrtfset(azim=30, elev=15)
plot(hrtf.left)
plot(hrtf.right)
show()
HRTFSet has a set of coordinates, which can be
accessed via the coordinates attribute, e.g.:
print hrtfset.coordinates['azim']
print hrtfset.coordinates['elev']
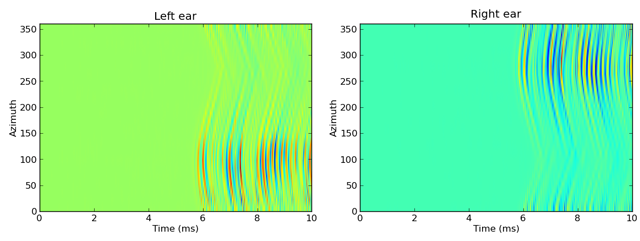
You can also generated filterbanks associated either to an HRTF or
an entire HRTFSet. Here is an example of doing this with the IRCAM
database, and applying this filterbank to some white noise and plotting the
response as an image:
# Load database
hrtfdb = IRCAM_LISTEN()
hrtfset = hrtfdb.load_subject(1002)
# Select only the horizontal plane
hrtfset = hrtfset.subset(lambda elev: elev==0)
# Set up a filterbank
sound = whitenoise(10*ms)
fb = hrtfset.filterbank(sound)
# Extract the filtered response and plot
img = fb.process().T
img_left = img[:img.shape[0]/2, :]
img_right = img[img.shape[0]/2:, :]
subplot(121)
imshow(img_left, origin='lower left', aspect='auto',
       extent=(0, sound.duration/ms, 0, 360))
xlabel('Time (ms)')
ylabel('Azimuth')
title('Left ear')
subplot(122)
imshow(img_right, origin='lower left', aspect='auto',
       extent=(0, sound.duration/ms, 0, 360))
xlabel('Time (ms)')
ylabel('Azimuth')
title('Right ear')
show()
This generates the following output:
For more details, see the reference documentation for HRTF,
HRTFSet, HRTFDatabase, IRCAM_LISTEN and
HeadlessDatabase.